
The “79 per cent chance” the Santa Rally is real
Stock markets have risen in 79 per cent of Decembers over the last three decades adding some substance to the myth of the “Santa Rally”, Schroders research has found.
The “Santa Rally” is a supposed effect of the Christmas feel-good factor, helping stock markets rise at the end of the year, although many seasoned investors remain unconvinced.
It’s unwise to draw firm conclusions from stock market history but in the spirit of festive fun, Schroders analyses the data each year.
Santa’s rally certainly existed in Britain last year: the FTSE 100 rose by 4.9 per cent. But yuletide cheer was less apparent elsewhere. The S&P 500 rose by only 1.0 per cent and the MSCI World index edged up by 1.3 per cent. Only the Eurostoxx 50, a measure of Europe’s biggest stocks fell, down by 1.8 per cent, of the indices we analysed.
But that was just one year. The longer-term picture reflects a pattern. Our analysis found global stock markets, as measured by the MSCI World index, have risen in 79 per cent of Decembers since 1987, making it the best month of the year for stocks on average over the last 32 years.
April was next best with stock markets rising 74.3 per cent of the time followed by October, at 68.6 per cent. June was the worst month with markets rising around a third of the time (36.7 per cent).
Which month has registered the biggest gains?
It has not just been about the frequency of rises in December, but also the size of the gains. Global stock markets have risen by an average of 2.1 per cent in December, since 1987. It is the highest average gain of any month. August has been the worst month, with the stock market index falling by an average of 1 per cent.
To underline this, Schroders analysed the performance of four stock market indices: FTSE 100, S&P 500, MSCI World and Eurostoxx 50 between 31 December 1986 and 31 October 2018. The chart below combines data of those major equities indices to show the frequency with which they rose in each month since 1987.
The frequency of stockmarkets rising per month since 1987
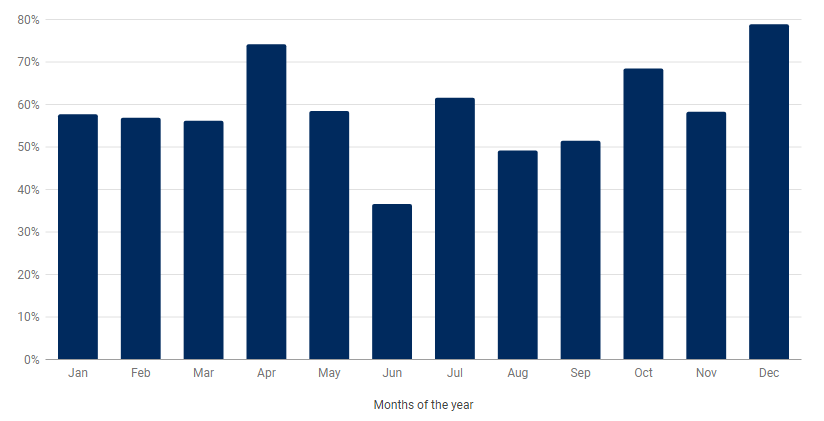
Source: Schroders. Thomson Reuters Datastream data for FTSE 100, S&P 500, MSCI World and Eurostoxx 50 correct between 31 December 1986 and 31 October 2018. Represents an average of the four indices.
This material is not intended to provide advice of any kind. Information herein is believed to be reliable but Schroders does not warrant its completeness or accuracy. Past performance is not a guide to future returns and may not be repeated.
Investors should note the data for the month of October. It seems to underline the point on the unpredictability of markets.
October has the third highest frequency of gains and the joint third highest average rise. But historically it is also the month that has included some of the biggest stock market falls.
October 1987: Black Monday
On 19 October 1987 global stock markets crashed amid worries about a slowing global economy and high stock valuations. The concerns were compounded by a computer glitch. Global stocks fell on average by 23% in October that year.
October 1997: Asian financial crisis
The Asian financial crisis began in the summer of 1997. A sequence of currency devaluations in Asia rocked global confidence. Global stocks fell by 6.6 per cent in October that year.
October 2008: Global financial crisis
The seeds of the global financial crisis were sown when the US housing market began to collapse in 2007. The full extent wasn’t realised until Lehman Brothers investment bank collapsed in September 2008. The global financial system seized up and a month later global stocks had fallen by more than 15 per cent.
October 2018: Trade wars and rising rates
Investors fretted about issues such as US-China trade tensions, European political uncertainty and the withdrawal of quantitative easing stimulus programmes. Global stocks fell 7.4 per cent in October. It was the worst monthly performance for stocks globally in six years and it was the tenth worst in the last decade.
Read more:
- Black Monday 30 years on: how it happened and what we can learn
- 20 years on: could the Asian financial crisis be repeated?
- 10 years on from Lehman’s collapse: seven charts to consider
- Shocktober: the story of the worst month for stocks in six years
The chart below again combines data of those major equities indices mentioned above to show the average gains by month in stocks over the last 32 years.
Average stockmarket gains by month since 1987
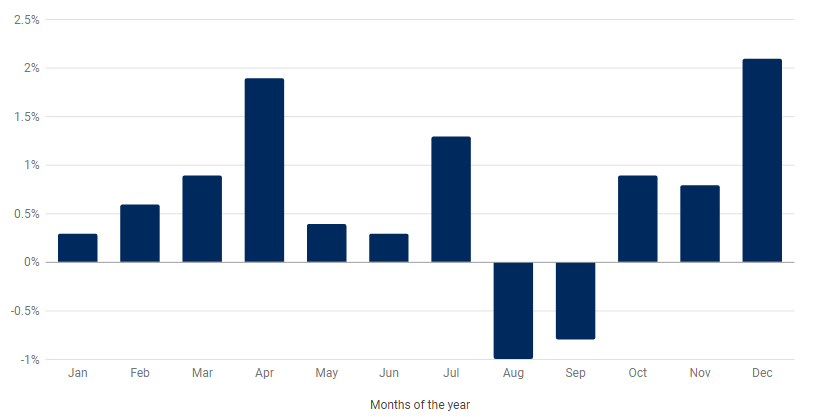
Source: Schroders. Thomson Reuters Datastream data for FTSE 100, S&P 500, MSCI World and Eurostoxx 50 correct between 31 December 1986 and 31 October 2018. Represents an average of the four indices.
This material is not intended to provide advice of any kind. Information herein is believed to be reliable but Schroders does not warrant its completeness or accuracy. Past performance is not a guide to future returns and may not be repeated.
Why have stock markets performed better in December?
There is much speculation as to the reasons for the “December effect”. One theory is based around investor psychology. There is, perhaps, more goodwill cheer in the markets due to the holiday season putting investors in a positive mood, which drives more buying than selling.
Another view is that fund managers, which account for a substantial part of share ownership, are re-balancing portfolios ahead of the year-end.
The danger of superstitions
Claire Walsh, Personal Finance Director at Schroders, said: “Stock market history can be fascinating, Investors will often instinctively hunt for patterns that might give a clue to the future. These often lead to assumptions – that Octobers are bad or that you should sell in May because summer months are poor performers.
“Of course stock market superstitions are only true until they fail to be. Those looking to gamble that Santa’s goodwill will support the market do so at their own risk. Just because it’s been more likely to happen before, doesn’t mean it will again.
“In fact, trying to time markets at all is a questionable strategy as it is impossible to predict short-term movements in the market.”
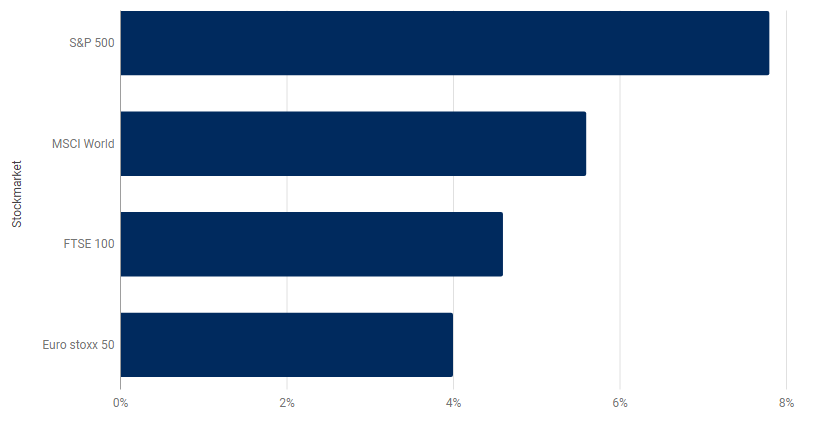
The chart below suggests the merits of having taken a long-term approach. While there have been many ups and downs, the rise in the S&P 500 index represents an average of 7.8 per cent a year since the start of 1987. The worst average annual rise for the indices analysed was the Eurostoxx 50 at 4.0 per cent a year. The figure for the MSCI World index was 5.6 per cent.
The gains are far more impressive if the income paid to investors had been reinvested. In this scenario, the annual returns for the MSCI World rises to 8.0 per cent
The FTSE 100 return rises from 4.6 per cent to 8.6 per cent a year, with reinvested income included. A UK investor who invested a notional £1,000 in the FTSE 100 on 31 December 1986 and left the money untouched for 32 years would now theoretically have £14,154, not including the effects of inflation or charges.
Annualised growth rates for stockmarkets: 1987-2017
Please remember that past performance is not a guide to future performance and may not be repeated. The value of investments and the income from them may go down as well as up and investors may not get back the amounts originally invested.
Source: Schroders. Thomson Reuters Datastream data for FTSE 100, S&P 500, MSCI World and Eurostoxx 50 correct as at 31 October 2018. Growth rate calculated between 31 December 1986 and 31 October 2018.
This material is not intended to provide advice of any kind. Information herein is believed to be reliable but Schroders does not warrant its completeness or accuracy.
Important Information: This communication is marketing material. The views and opinions contained herein are those of the author(s) on this page, and may not necessarily represent views expressed or reflected in other Schroders communications, strategies or funds. This material is intended to be for information purposes only and is not intended as promotional material in any respect. The material is not intended as an offer or solicitation for the purchase or sale of any financial instrument. It is not intended to provide and should not be relied on for accounting, legal or tax advice, or investment recommendations. Reliance should not be placed on the views and information in this document when taking individual investment and/or strategic decisions. Past performance is not a reliable indicator of future results. The value of an investment can go down as well as up and is not guaranteed. All investments involve risks including the risk of possible loss of principal. Information herein is believed to be reliable but Schroders does not warrant its completeness or accuracy. Some information quoted was obtained from external sources we consider to be reliable. No responsibility can be accepted for errors of fact obtained from third parties, and this data may change with market conditions. This does not exclude any duty or liability that Schroders has to its customers under any regulatory system. Regions/ sectors shown for illustrative purposes only and should not be viewed as a recommendation to buy/sell. The opinions in this material include some forecasted views. We believe we are basing our expectations and beliefs on reasonable assumptions within the bounds of what we currently know. However, there is no guarantee than any forecasts or opinions will be realised. These views and opinions may change. To the extent that you are in North America, this content is issued by Schroder Investment Management North America Inc., an indirect wholly owned subsidiary of Schroders plc and SEC registered adviser providing asset management products and services to clients in the US and Canada. For all other users, this content is issued by Schroder Investment Management Limited, 1 London Wall Place, London EC2Y 5AU. Registered No. 1893220 England. Authorised and regulated by the Financial Conduct Authority.