
How does factor investing stack up? A historical overview


Interest in ‘factor investing’ reached an all-time high in May according to Google Trends.
As a result, fund management companies and investment banks released a flood of smart beta and risk premia products.
Investors should consider the market outlook for these products since factors can have significant multi-year drawdowns just like the equity markets. And successful factor timing, like timing the equity market, is notoriously difficult.
We analysed factor valuations using fundamental metrics and contrasted these current valuations with historical averages as a way to determine what factors are most attractive.
Our method
We analysed six well-known factors — value, size, low volatility, momentum, quality, and growth — using definitions close to academic standards, such as Fama-French, for example. Factor data is available for most developed countries, but we focused on the United States, Europe, and Japan as they have the largest stock markets, making the results more meaningful. We used the top and bottom 10% of the stocks to construct the long and short portfolios.
Historic fundamental valuation trends
We determined how well-priced a factor was by applying the difference in book value multiples between the long and short portfolios. This is equivalent to valuing stocks based on their book value multiple or other fundamental metrics.
With factors, the more negative the spread, the cheaper the factor. Why? Because the long portfolio trades at a lower multiple than the short, so a spread of -5.0x could result if a long portfolio was valued at 1.0x (cheap) versus the short portfolio at 6.0x (expensive).
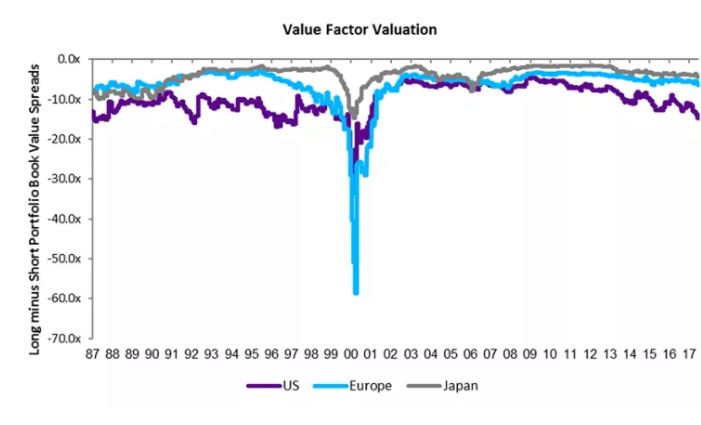
The chart below shows the book value spread for the value factor from 1987 to 2017. The tech bubble in the late 1990s and early 2000s had a huge influence on the spread, as the value factor experienced significant drawdowns, with tech stocks trading at levels far from fundamentals. In general, the value factor traded at a negative spread — a logical result, since the long portfolio is always cheaper than the short.
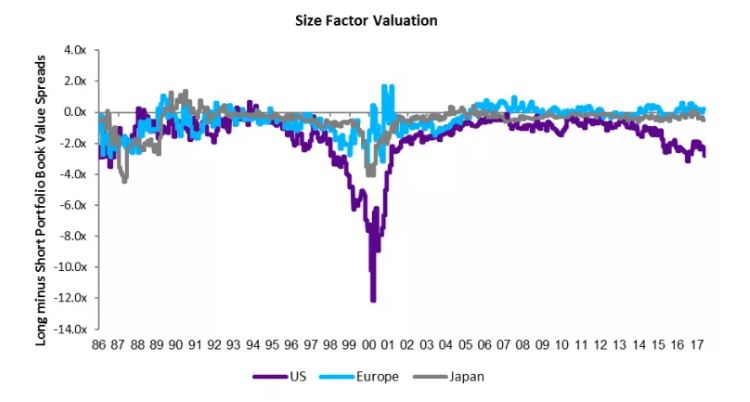
The tech bubble also affected the valuation spreads of the size factor, which was long for companies with a low market capitalization and short for those with large market capitalizations. The average spread — excluding the tech bubble period — was close to zero, indicating that the long and short portfolios are valued similarly from a book value perspective.
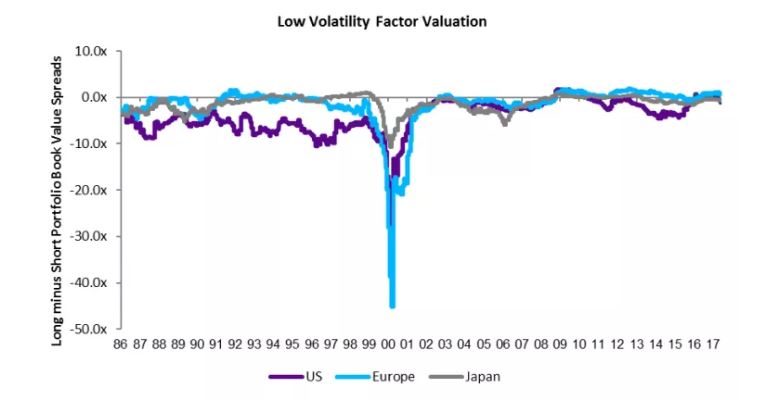
On average, the low volatility factor had negative spreads. The long portfolio contained stocks with low volatility or low beta. These equities tended to be cheap and unexciting. The short portfolio, on the other hand, contained stocks with high volatility that tended to be more expensive.
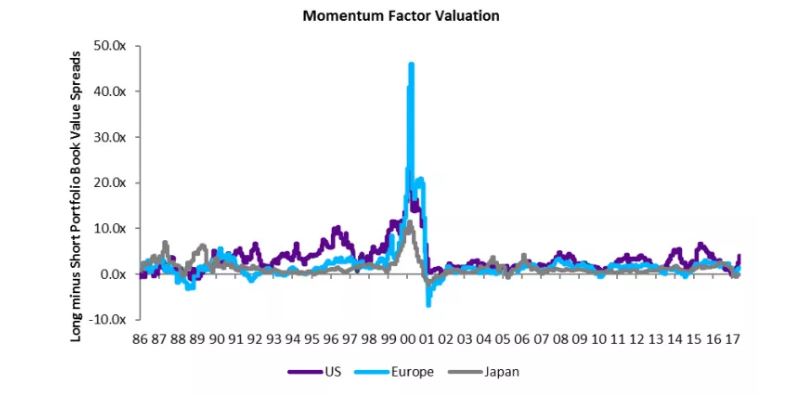
In contrast, the valuation spread for the momentum factor was positive on average. Stocks in the long portfolio — the “winners” in our analysis — were typically more expensive than those in the short portfolio — our “losers.”
The quality factor was largely the opposite of value, as reflected in the valuation spreads. Stocks with high-quality characteristics tended to be more expensive from a fundamental perspective than their low-quality counterparts.

The last factor, growth, averaged positive spreads — again an intuitive outcome since high-growth companies tend to be pricier than low- or negative-growth firms.
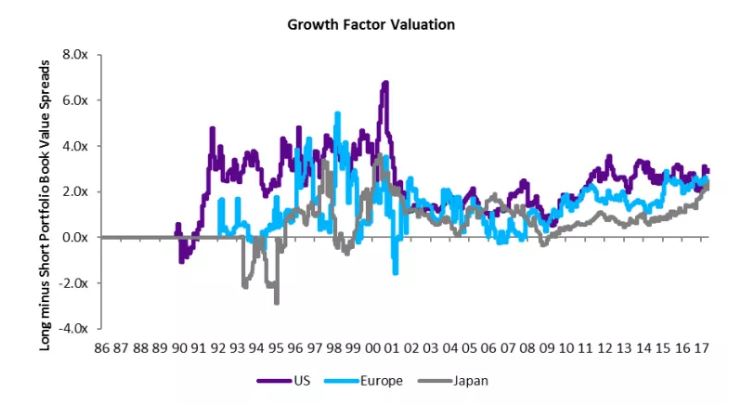
Current vs. historical factor valuation
Over the 30-year period, valuation spreads did not experience any meaningful structural shifts. For example, the spread of the value factor today is almost identical to what it was in 1987. The spreads indicate strong mean-reversion features — something that could be leveraged when assessing factor attractiveness. The tech bubble influenced all valuation spreads, distorting the historical averages. Including the tech bubble in the calculation — like including the global financial crisis when examining multiples or time series — should be done with caution since such events do not often repeat.
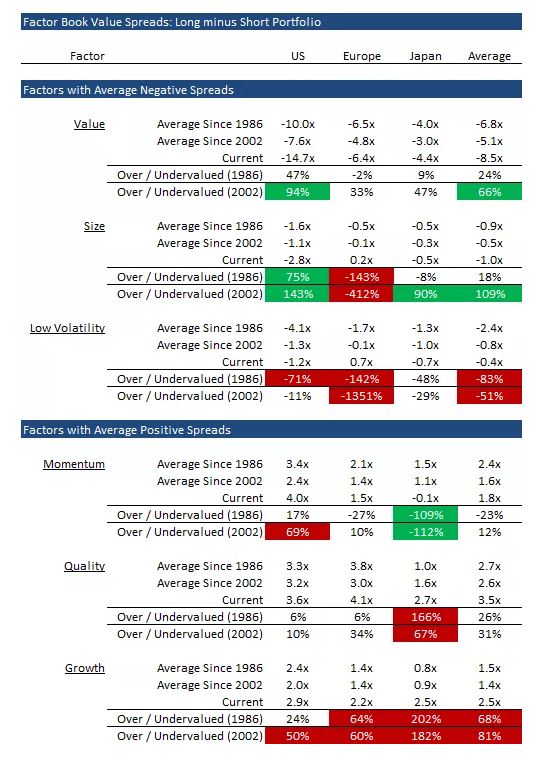
The table below shows the current valuation spreads compared to historical averages, once since 1986 and once since 2002, excluding the tech bubble. The factors with significant over- and undervaluation are shaded in green and red. The analysis highlights the following:
- Value: Cheap on average, especially in the United States.
- Size: Cheap on average.
- Low Volatility: Expensive across regions.
- Momentum: Expensive in the United States; cheap in Japan.
- Quality: Expensive in Japan.
- Growth: Expensive across regions.
Since there is little evidence that expensive valuations matter for short-term factor performance, this methodology has its flaws. When reflecting the valuations of stocks, valuation spreads can go to extremes.
Yet there is an important takeaway: For an investor with a medium- to long-term horizon, where starting valuations can affect expected returns, cheap factors may be preferable to expensive ones.
If you liked this post, don’t forget to subscribe to the Enterprising Investor