
Which stock markets look ‘cheap’ after the rapid rebound?

We look at how five regional markets stack up on various valuation measures.
Early last week, the short answer as to which markets looked cheap was: none.
Despite everything that 2020 has thrown at it, at one stage the US stock market was up for the year overall. Other markets had also regained a lot of lost ground. This has occurred while corporate earnings are falling, forecasts are being slashed, and dividends are being cut.
Things look a little better today after markets fell heavily in the past seven days. However, with the “cheapness” that was in abundance earlier in the year all but evaporated, to be positive on equities from here you really need to rely on the view that the post-lockdown recovery is sustainable.
How do current valuations compare with history?
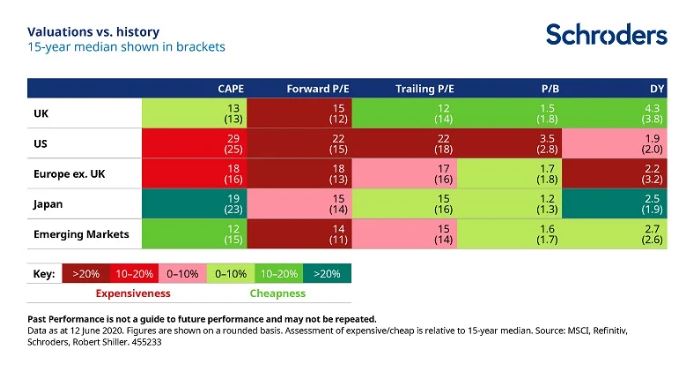
The table below shows a number of valuation indicators compared with their average (median) of the past 15 years, across five different regional equity markets. A description of each valuation indicator is provided at the end of this article. Figures are shown on a rounded basis, with the shading indicating the degree of expensiveness or cheapness compared with the 15-year average (median).
A disconnect with the economy and corporate fundamentals?
It is true that the economy and the stock market are not the same thing, as we have written before. Just because the economy is going into a nosedive does not mean that the stock market will do likewise. For one thing, share prices are forward looking, taking account of what is expected for years to come, not just the here and now.
Nonetheless, the incongruity we are seeing, with share prices rising while every measure of corporate health you care to look at is worsening, is really something.
This can be seen in the chart below, which shows how various indicators of corporate health which matter to stock market investors have changed since markets bottomed on 23 March.
For more:
– Watch: Why do markets rise when economies slump?
– Read: Why we think the recovery will be U-shaped
– Learn: Three behavioural biases to watch out for during a crisis
Markets have risen while corporate fundamentals have weakened
Change in share prices and corporate fundamentals for five regional stock markets between 23 March 2020 and 12 June 2020.
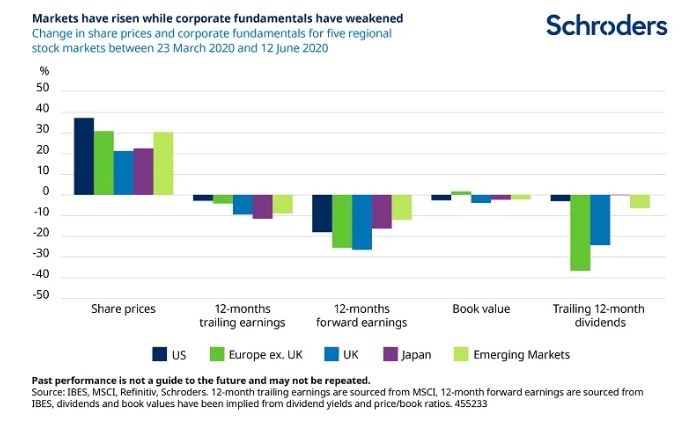
Even if we look further out, to the end of 2022, US, European and UK earnings are forecast to be around 10-15% lower than was the case on 23 March. It is hard to view this as anything other than a very “frothy” market environment.
Stocks may be expensive but so is everything else
So what could this mean for investors? Cash rates are next to nothing and the long-term return prospects from bonds at current yields remain well below what investors would have got in the past. This leaves investors in a bit of a quandary. Stocks may look expensive, but so does everything else.
In fact, when you compare the relative value of global stock markets with other asset classes like bonds, they offer pretty decent value. In practical terms, expected returns for all asset classes are below historical norms but the additional premium available from stocks over cash or bonds remains attractive (although it is important to note stocks are generally seen as a ‘higher risk’ investment).
Diversification can help navigate uncertainty
In relative valuation terms, the US stands out as being the most expensive stock market. However, this is a title that it has held for the past decade without it being a barrier to its outperformance. Non-US markets appear cheaper but come with additional risks – Europe is plagued by low growth and tensions within the Eurozone, the UK market is exposed to movements in commodity prices, Japan is a serial underperformer, and emerging markets are vulnerable to a combination of slowing commodity demand and weaker growth in China. Diversification is one of the tools longer-term investors can use to navigate this uncertainty.
The value of investments and the income from them may go down as well as up and investors may not get back the amounts originally invested
This information is not an offer, solicitation or recommendation to buy or sell any financial instrument or to adopt any investment strategy.
The pros and cons of stock market valuation measures
When considering stock market valuations, there are many different measures that investors can turn to. Each tells a different story. They all have their benefits and shortcomings so a rounded approach which takes into account their often-conflicting messages is the most likely to bear fruit.
Forward P/E
A common valuation measure is the forward price-to-earnings multiple or forward P/E. We divide a stock market’s value or price by the earnings per share of all the companies over the next 12 months. A low number represents better value.
An obvious drawback of this measure is that it is based on forecasts and no one knows what companies will earn in future. Analysts try to estimate this but frequently get it wrong, largely overestimating and making shares seem cheaper than they really are.
Trailing P/E
This is perhaps an even more common measure. It works similarly to forward P/E but takes the past 12 months’ earnings instead. In contrast to the forward P/E this involves no forecasting. However, the past 12 months may also give a misleading picture.
CAPE
The cyclically-adjusted price to earnings multiple is another key indicator followed by market watchers, and increasingly so in recent years. It is commonly known as CAPE for short or the Shiller P/E, in deference to the academic who first popularised it, Professor Robert Shiller.
This attempts to overcome the sensitivity that the trailing P/E has to the last 12 month’s earnings by instead comparing the price with average earnings over the past 10 years, with those profits adjusted for inflation. This smooths out short-term fluctuations in earnings.
When the Shiller P/E is high, subsequent long term returns are typically poor. One drawback is that it is a dreadful predictor of turning points in markets. The US has been expensively valued on this basis for many years but that has not been any hindrance to it becoming ever more expensive.
Price-to-book
The price-to-book multiple compares the price with the book value or net asset value of the stock market. A high value means a company is expensive relative to the value of assets expressed in its accounts. This could be because higher growth is expected in future.
A low value suggests that the market is valuing it at little more (or possibly even less, if the number is below one) than its accounting value. This link with the underlying asset value of the business is one reason why this approach has been popular with investors most focused on valuation, known as value investors.
However, for technology companies or companies in the services sector, which have little in the way of physical assets, it is largely meaningless. Also, differences in accounting standards can lead to significant variations around the world.
Dividend yield
The dividend yield, the income paid to investors as a percentage of the price, has been a useful tool to predict future returns. A low yield has been associated with poorer future returns.
However, while this measure still has some use, it has come unstuck over recent decades.
One reason is that “share buybacks” have become an increasingly popular means for companies to return cash to shareholders, as opposed to paying dividends (buying back shares helps push up the share price).
This trend has been most obvious in the US but has also been seen elsewhere. In addition, it fails to account for the large number of high-growth companies that either pay no dividend or a low dividend, instead preferring to re-invest surplus cash in the business to finance future growth.
A few general rules
Investors should beware the temptation to simply compare a valuation metric for one region with that of another. Differences in accounting standards and the makeup of different stock markets mean that some always trade on more expensive valuations than others.
For example, technology stocks are more expensive than some other sectors because of their relatively high growth prospects. A market with sizeable exposure to the technology sector, such as the US, will therefore trade on a more expensive valuation than somewhere like Europe. When assessing value across markets, we need to set a level playing field to overcome this issue.
One way to do this is to assess if each market is more expensive or cheaper than it has been historically.
We have done this in the table above for the valuation metrics set out above, however this information is not to be relied upon and should not be taken as a recommendation to buy/and or sell If you are unsure as to your investments speak to a financial adviser.
Finally, investors should always be mindful that past performance and historic market patterns are not a reliable guide to the future and that your money is at risk, as is this case with any investment.
Important Information: This communication is marketing material. The views and opinions contained herein are those of the author(s) on this page, and may not necessarily represent views expressed or reflected in other Schroders communications, strategies or funds. This material is intended to be for information purposes only and is not intended as promotional material in any respect. The material is not intended as an offer or solicitation for the purchase or sale of any financial instrument. It is not intended to provide and should not be relied on for accounting, legal or tax advice, or investment recommendations. Reliance should not be placed on the views and information in this document when taking individual investment and/or strategic decisions. Past performance is not a reliable indicator of future results. The value of an investment can go down as well as up and is not guaranteed. All investments involve risks including the risk of possible loss of principal. Information herein is believed to be reliable but Schroders does not warrant its completeness or accuracy. Some information quoted was obtained from external sources we consider to be reliable. No responsibility can be accepted for errors of fact obtained from third parties, and this data may change with market conditions. This does not exclude any duty or liability that Schroders has to its customers under any regulatory system. Regions/ sectors shown for illustrative purposes only and should not be viewed as a recommendation to buy/sell. The opinions in this material include some forecasted views. We believe we are basing our expectations and beliefs on reasonable assumptions within the bounds of what we currently know. However, there is no guarantee than any forecasts or opinions will be realised. These views and opinions may change. To the extent that you are in North America, this content is issued by Schroder Investment Management North America Inc., an indirect wholly owned subsidiary of Schroders plc and SEC registered adviser providing asset management products and services to clients in the US and Canada. For all other users, this content is issued by Schroder Investment Management Limited, 1 London Wall Place, London EC2Y 5AU. Registered No. 1893220 England. Authorised and regulated by the Financial Conduct Authority.